In my last column, I covered how you can use Google’s Search Console to learn about the health of your website.
Search Console has another helpful report, called Search Analytics, which gives you an overview of how your website is performing in Google’s organic (non-paid) search results — namely, it shows some of the search queries people used to click through to your website.
In this column, I’ll explain how to read the report. I’ll also share a few simple strategies on how small business owners can use it to improve a website’s non-paid Google search results and website marketing in general.
How to read the Search Analytics report
To access the report, log into Search Console, and then click “Search Traffic” in the left-hand navigation. Search Analytics is the first report listed within this menu option. If you’re not able to access Search Console, it may be because you have to verify your website first.
The Search Analytics report enables you to see search data from various perspectives. As you can see in Figure 1, you can filter by Queries, Pages, Countries, Devices and Search Type (Web, Image or Video). Within each of these, you can filter more granularly: Click the radio button for Devices, for example, and you can filter by Desktop, Mobile or Tablet.
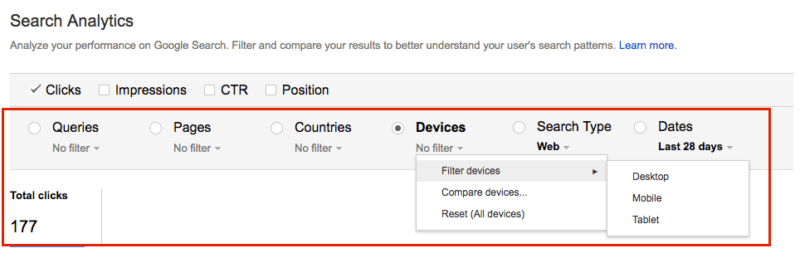
Figure 1: Search Analytics report filters
You can also customize the date range. Unlike Google Analytics, which archives data for years, Search Console only shows the last 90 days of search query data.
At the top of the report, you can check four boxes: Clicks, Impressions, CTR and Position. Once you check these, the data then appears in the rows below. (Figure 2).
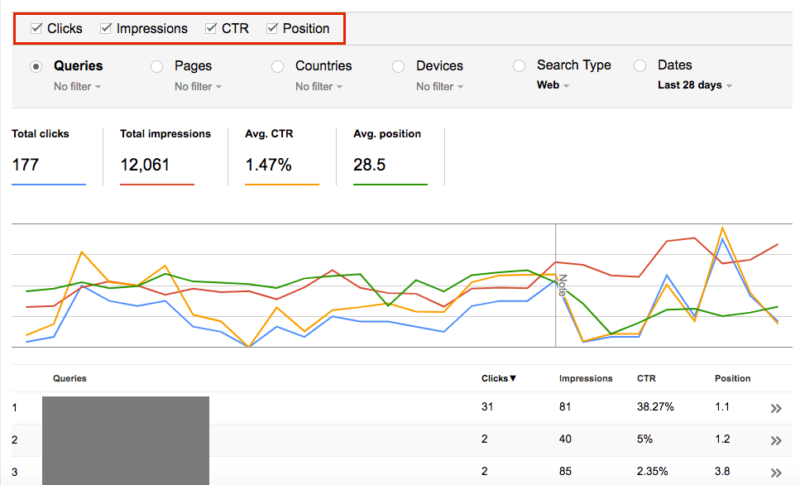
Figure 2: Search Analytics report showing Clicks, Impressions and more.
Search Console data differs from what you see in Google Analytics, and if you’re a new user, it can be a little confusing, as the terms aren’t the same. In Google Analytics, for example, visits to a website are called “Sessions” — and one person can have multiple sessions.
Analytics also shows Sessions data by Channel, meaning the source of the searcher: Organic (non-paid search, including non-Google properties), Paid, Referrals, Direct and Social.
Search Console, on the other hand, provides click data, which refers only to the people who clicked through from the Google search engine to your website.
What I like about Search Console is that it lets you see the actual search queries people used when clicking through to a website. Before you get too excited, however, you should note that Google gives you only a small percentage of these queries — and the way it presents this data can be a little confusing at first.
If you use AdWords, the terms Clicks, Impressions, CTR and Position should look familiar to you, but if you don’t, here’s what they mean:
Clicks
This is the number of clicks to your website per search query. Caution: Google does not provide search query data for each of the clicks to your website for the selected time range.
In Figure 2 (above), you can see that this particular website had 177 clicks for the last 28 days. The actual search query data, however, only shows 49 of those clicks (i.e., 28%).
Impressions
This is the number of times your website listing appeared in the Google search results for various searches. In Figure 2 (above), you can see Search Console shows 12,061 impressions. Caution: Google counts impressions any time your website (including images) appears for a search result — even if your listing is on page 8 (where no one sees it).
Google also counts impressions for search queries that may not be relevant to your business. For example, if you have client names listed on your website, your client list page could show up for a search result for one of the companies listed. Google counts this as an impression.
For the Search Analytics report, Google tracks impressions for hundreds of search queries, whether or not they resulted in clicks. For the report in Figure 2, Google provided impression data for 500 queries, but Google will provide more. The amount of impression data provided generally depends on how much traffic you get.
CTR
CTR stands for click-through rate. To calculate the CTR, take the number of impressions and divide it by the number of clicks.
For the report in Figure 2, the CTR is 1.47% — which can look a little disheartening at first. But, since we already know the impressions data includes hundreds of search queries (many of which may not be relevant), you have to do your own number crunching to determine the CTR for the actual queries showing in the report.
To do this, you can download the Queries report into Excel or Sheets — see Figure 3 (below). Note: I created sums for the Clicks and Impressions columns for the 16 queries that had clicks, which is all the data Google provided. So, 16 queries resulted in 49 clicks and 1,464 impressions: 1,464/49 = 30% CTR.
Remember, the 49 clicks represent 28% of the 177 total clicks, so the 30% CTR is simply a glimpse into how your website might be performing.

Figure 3: Search Analytics data in Excel
Position
Looking again at Figure 2 above, Position refers to where your website listing appeared on the search engine results page (SERP). Generally, Google shows 10 organic listings per page, and these listings include Shopping, images, video, Answer Boxes and Map Packs — and don’t include the up to four AdWords listings at the top (and sometimes bottom) of the SERP.
A Position of 9.4 means page 1; a Position of 17 means page 2.
Now that you know how to read the Search Analytics report, you can use the data to help improve your SEO and content marketing efforts. Since the report lets you filter data any number of different ways, I’ve listed a few simple strategies on how you can put it to use.
Strategy #1: Analyze search query data once per quarter
Although Google doesn’t give you 100 percent of the your website’s query data, the Search Query report is still is a goldmine of information — if you take the time to sift through it.
What our agency, Huff Industrial Marketing, does is go through the full report for clients every quarter. We delete non-relevant queries, highlight relevant queries, and then group them by theme: e.g., by individual products and services.
Using this information, we then do a number of different things, depending on the client.
For example, you could use search query information to determine which types of content pages to create that might be missing from your website. For our manufacturing clients, this content includes FAQs, tech tips, app notes, case studies, resources, FAQs, glossary additions, blog posts and so on.
TIP: To easily handle the data, download it into Excel or Sheets (look for the Download button at the bottom of the report — Figure 4). To prevent overwhelm, it pays to delete the non-relevant queries before you begin your in-depth analysis.
You can also filter query data by keyword without having to download the full report: click the Query radio button, then type in the keyword.
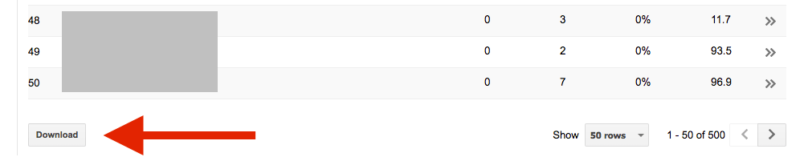
Figure 4: Search Analytics report download button
Strategy #2: Improve SEO/CTR
Once you’ve downloaded the query data, you can skim through it to determine which queries had a relatively high CTR and which had low CTR — and why.
It could be that a search query is highly specific and thus has a low number of impressions but a high CTR.
Or the search query can be more generic in nature, so it had a high number of impressions and low CTR — which could mean the query is competitive, your page needs SEO work (or both), or any number of other factors.
We like to run searches for the more high-value queries to see how the client website listing appears on the Google SERP. What we’re looking for:
- How does the listing read?
- Any typos in the title/meta description tags? Do they need tweaking?
- What other listings appear on the page?
- Does the client have other items that appear, such as images? (You can filter the Search Analytics report to home in on Images search results data, too.)
[Read the full article on Search Engine Land.]
Some opinions expressed in this article may be those of a guest author and not necessarily Marketing Land. Staff authors are listed here.
About The Author

Popular Stories
Related Topics