Tag: infographics

Social Video in 2020: The Viewpoints of Marketers and Consumers [2 Infographics]
How to Create and Use Infographics for Your Content Marketing
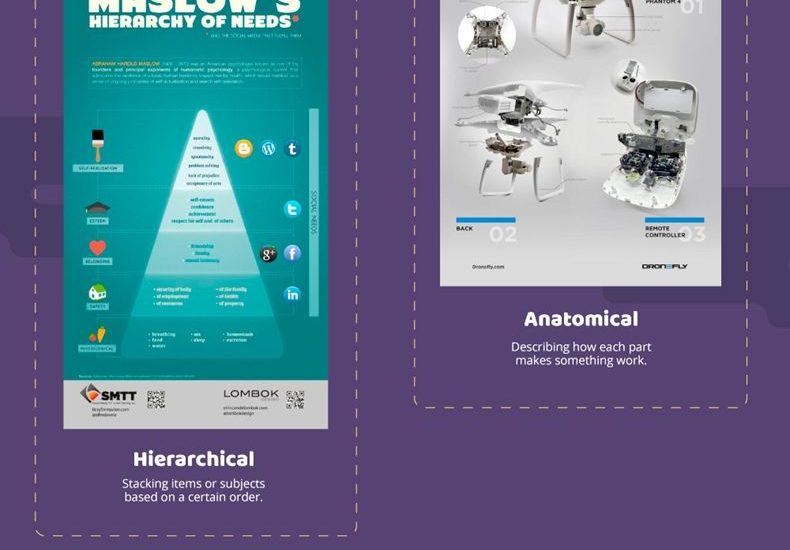
How to Use Infographics as Effective Marketing Tools [Infographic]
A Guide to Using Infographics for Lead Generation [Infographic]

Online Marketing News: Shareable Infographics, Instagram Buyable Tags & YouTube End Screens


The Ultimate Guide to Creating Shareable Infographics Using PowerPoint or Keynote
Infographics work to capture the attention of your audience and convey information in a digestible way. It can be tough to find the resources to creat them. But, what if creating infographics yourself was suddenly easier? This infographic will show you how. HubSpot
Instagram Is Letting Brands Test Taggable, Buyable Products in Photos
Instagram is letting select brands — like Kate Spade — test organic posts with taggable, buyable products in their photos. Brands can tag products for sale within their organic posts that will link interested viewers directly to their website to purchase. This, according to Instagram, is a play to make the user’s purchase experience frictionless. AdWeek
Keep ‘Em Watching with End Screens
YouTube launched ‘End Screens’ — a mobile friendly tool that lets video producers engage with their audience in a more targeted way at the end of their videos. The tool allows for hard-to-miss thumbnails to pop up after a video that prompt viewers to engage with other video content from that channel, subscribe to the channel and more. YouTube Creator Blog
Snaplytics launches Snapchat analytics
Marketing Land reports: “A Danish startup is now offering a new analytics service for Snapchat’s disappearing videos and photos that it says is ‘the only software-as-a-service analytics [exclusively] for Snapchat.'” The dashboard lets users see metrics like open rates, views, screen shots taken, and more. Marketing Land
Google Ran Secret Video Ad Experiments and Here’s What It Found
Advertising Age reports: “The average completion rate for the average video ad on mobile devices is 22%, according to Google. On desktop, it’s 28%. The best-performing video in the test, one in which fast pacing was the dominant factor, achieved a 33% “view-through” rate on mobile., Google said.” Advertising Age
Manufacturing Marketers See Content Marketing Breakthrough [Research]
Last year, fewer than 20% of manufacturing marketers said their company was effective at content marketing or had a well-documented content marketing strategy. This year, 95% of manufacturing marketers report improvement in their content marketing, with 82% attributing that success to better content creation. Content Marketing Institute
The Top 20 Content Marketing Influencers of 2016
Ever wonder whom to look to for content marketing advice? This handy list provides 20 names of folks in the content marketing realm that are worth your attention. The list toutes big names like Joe Pulizzi, Ann Handley, Jeff Bullas and our very own Lee Odden. MarketingProfs
IAB: Search Ads Generate $16.3 Billion In First-Half 2016
Forrester research shows: “Mobile revenue rose 89% from the $8.2 billion reported during the first half of 2015 to $15.5 billion during the first half in 2016 of which mobile search contributed $7.4 billion.” Desktop and Mobile search ad revenue combined comprised 50% of the total. MediaPost
What were your top online marketing news stories this week?
I’ll be back next week with more online marketing news. Need a fix now? Follow @toprank for the latest industry news and insights.
The post Online Marketing News: Shareable Infographics, Instagram Buyable Tags & YouTube End Screens appeared first on Online Marketing Blog – TopRank®.

Online Marketing News: Infographics in SEO Strategy, Google Pixel & The Value of UX


Why Infographics Should Be Part of Your SEO Strategy [Infographic]
It isn’t just readers who appreciate the value of a good infographic — search engines do, too. Infographics drive more engagement and social shares, signaling bots that content is relevant to the searcher and is a good answer for what they’re looking for. But how do you create a great infographic? Read on for 6 simple steps to make your own. HubSpot
Google Pixel marketing push is worth $3.2M in ads and much more
Google released Google Pixel, their new smartphone offering, to the market and has made quite a splash. Google has reportedly spent $3.2 million in their initial advertising push for TV ads, and experts in the field believe that’s just the metaphorical tip of the iceberg in terms of spending. Their Pixel product is rumored to be poised to connect with the iPhone, which begs the question, how will this affect marketing and design for mobile devices? TECHMalak
The Business Value of User Experience Design [Infographic]
A good user experience on mobile is key to ecommerce success – users are more likely to stay on site and convert when a site is optimized for mobile. MarketingProfs reports on a recent PointSource study: “67% of customers are more likely to purchase on mobile-friendly sites. Mobile users are 5X more likely to abandon a task if the site is not optimized for mobile.” MarketingProfs
Best Times to Post on Social Media [+ 75 Industry Breakdowns]
TrackMaven evaluated the best times to post on social media based interactions per post per 1,000 followers during each hour of the day and day of the week. They found that Thursday evenings on Facebook and Twitter are good times to post, Wednesday mornings are best for LinkedIn, Friday evenings are best for Instagram, and Pinterest posts tend to do best in the wee hours of Friday morning. TrackMaven
It Pays to Provide Customer Service via Twitter (Report)
“Customers who receive responses when they tweet businesses are willing to spend 3 percent to 20 percent more on average-priced items from those businesses in the future,” reports SocialTimes. Not only are those customers more likely to spend more, they’re more likely to advocate for a brand socially that provides customer service via Twitter. SocialTimes
Report: on average day, nearly 40 percent of searchers use only smartphones
Google recently released new “cross device” research that tells us a substantial amount of web users are searching via mobile. According to MarketingLand: “Users spend 170 minutes on their smartphones daily vs. 120 minutes on PCs and roughly 75 minutes on tablets (for those who own tablets).” MarketingLand
New IAB Standards Promise Major Ad Shakeup
“The Interactive Advertising Bureau’s new formats and standards for ad units will have a major, positive impact on user experience — helping to stem the tide of ad blocking” reports MediaPost. These standards were released on September 26th and will be available for public comment until the end of November. MediaPost
Snapchat courts Hollywood producers for new programming
Snapchat is actively recruiting hollywood producers to create shows for its Discover platform. This, following last week’s break from the title of ‘social media’ shows a change in the way media platforms are thinking about the content they create. Digiday
What were your top online marketing news stories this week?
I’ll be back next week with more digital marketing news. If you just can’t wait for more, follow @toprank on Twitter for your daily dose of industry happenings.
The post Online Marketing News: Infographics in SEO Strategy, Google Pixel & The Value of UX appeared first on Online Marketing Blog – TopRank®.
